
VEXTOR Earnings Report
TRADING REPORT
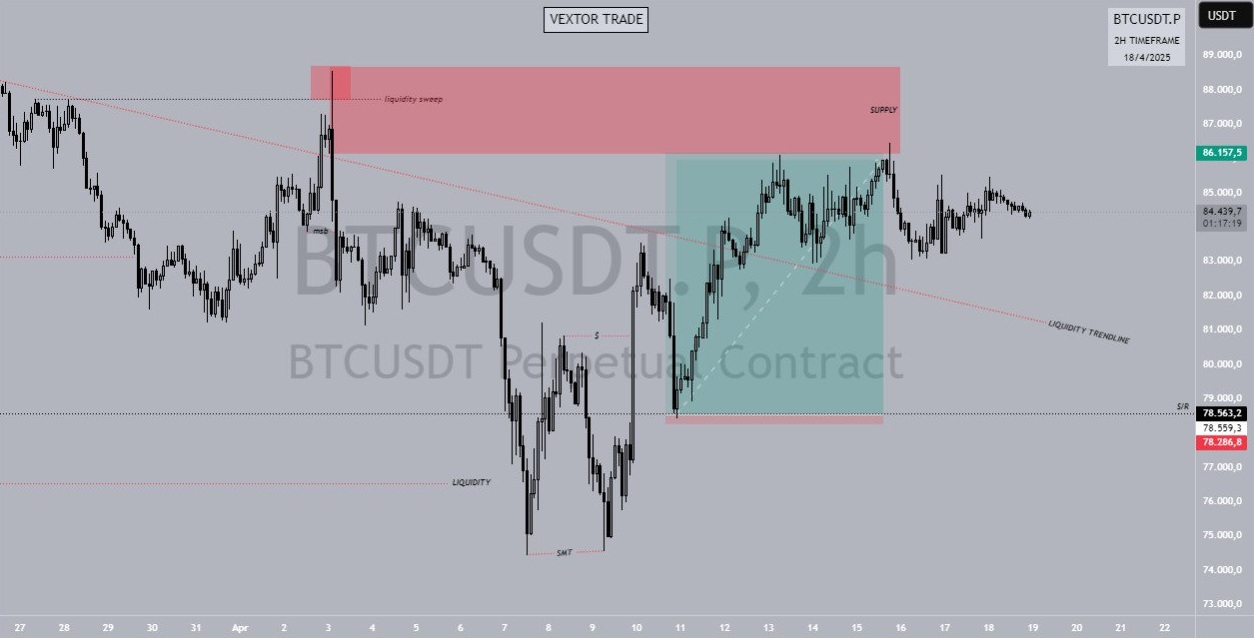
Period: 14-18 April 2025
Reported on: Saturday, April 18, 2025
By: VEXTORTRADE
1. Weekly Summary
- Opening Price (April 14): $83,200
- Closing price (April 18): $85,895 (+3.24% weekly)
- Volatility: weekly price range of $80,500 - $86,300 (initial correction followed by bullish rally).
- Total Volume: $280 billion (up 15% vs. the previous week).
2. Daily Analysis (April 14-18, 2025)
14 April 2025
- Price: $83.200 → $81.800 (-1,68%)
- Catalyst: Profit-taking after weekend overbought sentiment.
- Volume: $48 billion (dominant sell-off in the $83,000 zone).
- Key Levels:
- Support: $81,000 (50-day MA retest).
- Resistance: $83,500.
15 April 2025
- Price: $81.800 → $84.100 (+2,81%)
- Catalyst: institutional purchases (US bitcoin ETF inflow of $180 million).
- Volume: $62 billion (dominant buyers below $82,000).
- Breakout: break resistance $83,500 with RSI 58 (neutral-bullish).
16 April 2025
- Price: $84.100 → $85.200 (+1,31%)
- Catalyst: US CPI release (inflation down to 2.8%), prompting speculation *rate cut* Fed.
- Volume: $70 billion (highest this week).
- Technical pattern: Breakout of the *ascending triangle* pattern on the 4-hour TF.
17 April 2025
- Price: $85.200 → $86.300 (+1,29%)
- Catalyst: positive sentiment from Japan's crypto regulation (taxes down).
- Volume: $55 billion (profit-taking in the $86,000 zone).
- Psychological Level: $87,000 resistance test failed (high $86,300).
18 April 2025
- Price: $86.300 → $85.895 (-0,47%)
- Catalyst: a small correction due to the action of *profit-taking* institutions.
- Volume: $45 billion (consolidated above $85,000).
- Indicator: RSI down to 66 (from a peak of 72 on 17 April).
3. Weekly Technical Analysis Patterns & Indicators
- Chart patterns:* Higher Highs & Higher Lows * (uptrend confirmation).
- Moving Average:
- 50-day MA: $83,200 (dynamic support).
- 200-day MA: $78,500 (long-term bullish).
- RSI (7 Days): 66 (neutral-bullish, short-term overbought risk).
- Ichimoku Cloud: the price is above the cloud (bullish signal).
Important Levels
- Main Support:
- $84,000 (liquidity zone of the institution).
- $82,500 (bullish defensive line).
- Resistance:
- $87,000 (breakout target).
- $90,000 (psychological target).
4. Fundamental & Sentiment Factors
1. Bitcoin ETF flow: weekly Inflow of $620 million (largest since Q1 2025).
2. Progressive Regulation:
- US & EU agree on KYC/AML standards for exchanges.
- Japan lowers crypto taxes, encourages retail adoption.
3. Halving 2026: BTC accumulation by miners up 22% (tight supply preparation).
5. Risk Factors
- Macroeconomics: the potential for rising interest rates if US inflation rebounds.
- Geopolitics: Iran-Israel tensions trigger increased volatility of risk assets.
- Technical correction: Profit-taking in the zone of $86,000 - $87,000.
6. Trading Strategies (Next Week: April 21-25, 2025)
- Buy Zone:
- Accumulation at $84,000-$84,500 (stop-loss: $82,400).
- Breakout confirmation above $87,000 (target: $90,000).
- Sell Zone:
- Partial Take-profits at $87,000 and $89,000.
- Beware of bearish signals if $84,000 (risk of Correction to $ 80,000).
- Avoid:
- FOMO in the $86,000 + zone without volume confirmation.
- Short-term Hold if RSI >70.
7. Calendar Of Events (April 21-25, 2025)
- April 22: release of data on US retail sales (influence of risk sentiment).
- April 24: release of US GDP Q1 2025.
- April 25: ECB talks on digital currency policy.
8. Predictions & Recommendations
- Bullish Case:
- Breakout $87,000 → rally to $90,000 - $95,000 (Q2 2025).
- Long-term accumulation in the support zone ($84,000–$82,500).
- Bearish Case:
- If $ 82,500, correction to $ 78,500 (200-day ma).
- Use it as a buying opportunity for the medium term.
9. Weekly Summary
- Main trend: Bitcoin closed the week at +3.24% with bullish sentiment triggered by positive institutional and regulatory inflow.
- Key to success: discipline on support/resistance levels, manage risk with stop-loss, and take advantage of Corrections for accumulation.
- Alert: volatility of macro and geopolitical data.